

CSIRO spotlights a continent-wide hyperspectral mineral map
CSIRO has highlighted a roughly 100-metre-resolution hyperspectral layer covering Australia, built from satellite data to support mineral prospectivity analysis.
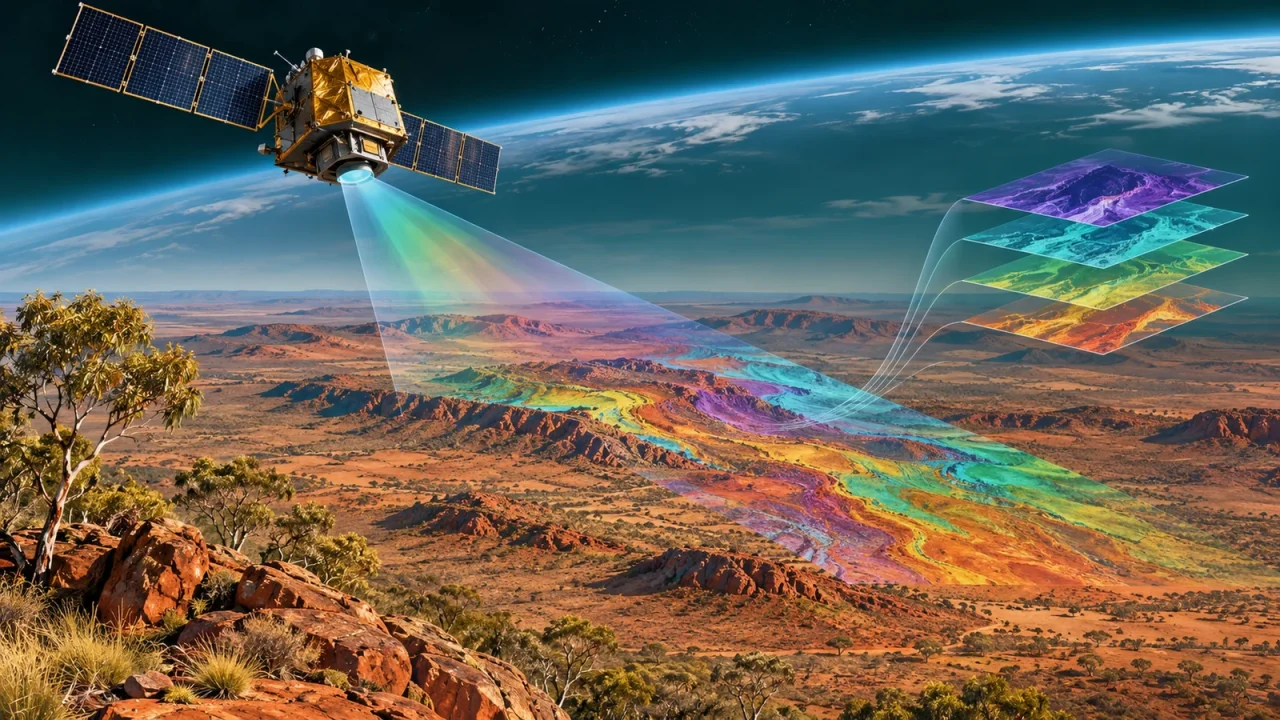
CSIRO has drawn attention to a continent-wide hyperspectral mapping capability designed to reveal mineral signatures across Australia from satellite observations.
The announcement is fresh, but the underlying public data layer is not brand new. The CSIRO Mineral Resources Data Portal records the current version as added and last updated on 29 May 2026. The 11 November news release explains the program and its potential uses.
How the map was assembled
CSIRO says its automated workflows combine observations from Italy’s PRISMA, Germany’s EnMAP and NASA’s EMIT missions. Together, these hyperspectral instruments measure reflected light across more than 200 narrow wavelength bands.
That is much richer spectral information than conventional multispectral imagery. The agency says more than 33,000 images were processed while accounting for cloud cover, data quality and differences between the satellite missions.
The first highlighted product is an aluminium sheet-silicate abundance index. The public portal describes the grid as having a stored resolution of 93.673 metres and links it to a CSIRO data collection with DOI 10.25919/pdzg-v366.
What explorers can use it for
Mineral abundance patterns can help geoscientists identify areas that deserve closer investigation. At continental scale, satellite sensing may narrow the search before more expensive field surveys, sampling and drilling begin.
The same processing capability could support environmental monitoring and agriculture, although those uses would require fit-for-purpose products and validation.
What the colours do not prove
A spectral signature is not the same thing as a mineral reserve. The map does not establish the grade, depth, volume or commercial recoverability of a deposit. Surface conditions, vegetation, weathering and sensor limitations also affect what remote sensing can reveal.
That distinction matters as Australia looks to expand critical-minerals supply chains for energy and manufacturing. The dataset can guide prospectivity analysis; it cannot replace on-ground geology or economic assessment.
Why this matters in Australia
Australia combines a large, sparsely populated landmass with strong demand for better information about critical minerals and environmental conditions. A consistent satellite-derived layer gives researchers, governments and explorers a common starting point for continental analysis.
The clean-energy connection is indirect but important. Critical minerals are inputs to batteries, power electronics and other technologies, while projects such as Australia’s waste-heat hydrogen demonstration show the parallel effort to build more energy technology locally.
Primary sources